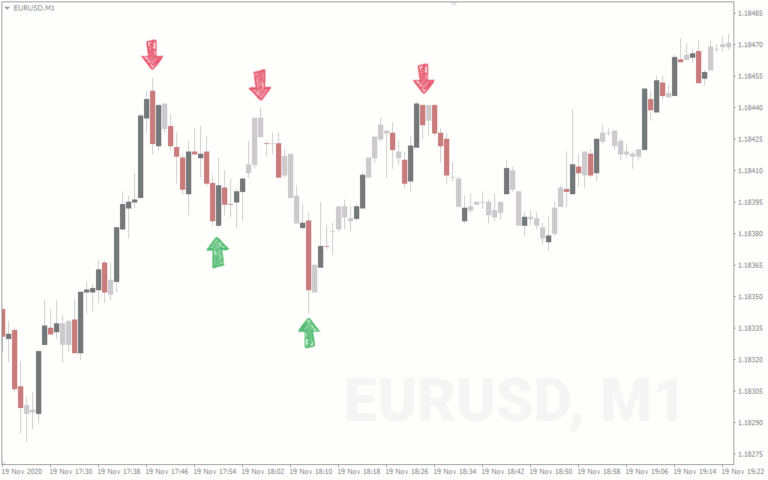

Can RSI Values Predict Market Reversals Accurately?
Can RSI values predict market reversals accurately? This question intrigues many traders. RSI, a popular technical indicator, gauges the speed and change of price movements. By identifying overbought and oversold conditions, RSI aims to signal potential reversals. But how reliable is it? Let’s dive into the mechanics, strategies, and pitfalls of using RSI to navigate market trends. If you are planning to trade Bitcoin, it’s essential to have a reliable trading platform. For more details, you may Go to zentrixai.com/.
The Mechanics of RSI: How It Works and Its Calculation
The Relative Strength Index (RSI) is a popular tool in technical analysis. It measures the speed and change of price movements. RSI is calculated using the average gains and losses over a specific period, usually 14 days. The formula is: RSI = 100 – (100 / (1 + RS)), where RS is the average of x days’ up closes divided by the average of x days’ down closes.
Imagine you track a stock for 14 days. On days when the stock goes up, you calculate the average gain. On days it goes down, you calculate the average loss. You then divide the average gain by the average loss to get the Relative Strength (RS). Plugging this into the formula gives you the RSI value, which ranges from 0 to 100.
An RSI above 70 suggests the asset is overbought and might be due for a correction. Below 30 indicates it’s oversold and could be set for a rebound. However, RSI isn’t foolproof. It’s important to look at other indicators and market conditions before making a move. RSI helps identify potential buy and sell signals, but it’s best used as part of a broader strategy. Do you use RSI in your trading? If not, it might be a good addition to your toolkit.
RSI in Different Market Conditions: Bullish vs. Bearish Markets
RSI behaves differently in bull and bear markets. In a bull market, RSI values tend to stay higher. This means even a slight dip can push the RSI into the “overbought” territory above 70. However, this doesn’t always signal an imminent reversal. During a strong uptrend, the RSI can remain in the overbought range for a while as prices continue to rise. This is why it’s crucial to consider the overall market trend.
In contrast, during a bear market, RSI values often remain lower. An RSI below 30 indicates an oversold condition, but like in bull markets, the asset might continue to decline before reversing. In bearish conditions, traders might see frequent oversold signals, but it’s essential to confirm with other indicators.
Market volatility also affects RSI readings. High volatility can cause quick shifts in RSI values, leading to potential false signals. Understanding how RSI behaves in different market conditions can help traders make better decisions. For instance, combining RSI with other tools like moving averages or MACD can provide more reliable signals. How do you adjust your RSI strategy in different market conditions? It’s always good to review and adapt your approach based on current trends.
Advanced RSI Strategies for Improved Prediction
Using RSI effectively often means going beyond the basics. One advanced strategy is to combine RSI with other indicators. For example, pairing RSI with moving averages can help confirm signals. If RSI indicates an overbought condition but the price is above a long-term moving average, it might suggest a stronger trend, reducing the likelihood of a false signal.
Another technique is adjusting the RSI period. While the 14-day period is standard, shorter periods (like 7-day) can make the RSI more sensitive to recent price changes. This can be useful in volatile markets. Conversely, longer periods (like 21-day) can smooth out the RSI, making it less prone to false signals in choppy markets.
RSI divergence is another powerful strategy. This occurs when the price moves in one direction, but RSI moves in another. For instance, if the price reaches a new high, but RSI forms a lower high, it could signal a potential reversal. This divergence can be a strong indicator that the current trend is weakening.
Using these advanced strategies requires practice and a good understanding of market conditions. Do you have a favorite RSI strategy? Trying different approaches and keeping track of their effectiveness can help refine your trading tactics.
Limitations and Pitfalls of Using RSI for Market Reversals
While RSI is a helpful tool, it has its limitations. One major pitfall is the potential for false signals. In volatile markets, RSI can frequently dip into overbought or oversold territories without leading to a significant price reversal. This can confuse traders and lead to premature decisions.
Another limitation is RSI’s reliance on historical data. It doesn’t account for sudden news or events that can impact prices dramatically. For instance, a company’s unexpected earnings report can cause price swings that RSI couldn’t predict. This is why it’s important to use RSI alongside other indicators and market news.
Over Reliance on RSI is another common pitfall. It’s easy to get caught up in the signals and ignore other critical factors. RSI should be part of a broader strategy, not the sole decision-making tool. For example, combining RSI with trend analysis or support and resistance levels can provide a more comprehensive view.
Conclusion
In trading, RSI is a valuable tool, offering insights into potential market reversals. While not foolproof, combining RSI with other indicators and strategies can enhance accuracy. Always stay informed and consult experts. Understanding RSI’s strengths and limitations can help you make better trading decisions. Ready to harness the power of RSI? Start exploring and refining your approach today!